
Bitcoin Rules – But Not Yet…
Vitalij Sova/iStock via Getty Images
Bitcoin Rules – But Not Yet…
Vitalij Sova/iStock via Getty Images
I’ve recently seen a number of bullish prognoses for Bitcoin (BTC-USD). While my heartstrings pull in that direction, my rationale self – as well as my reading of the tea leaves – eeehhh I mean technical charts – tells me it just ain’t so.
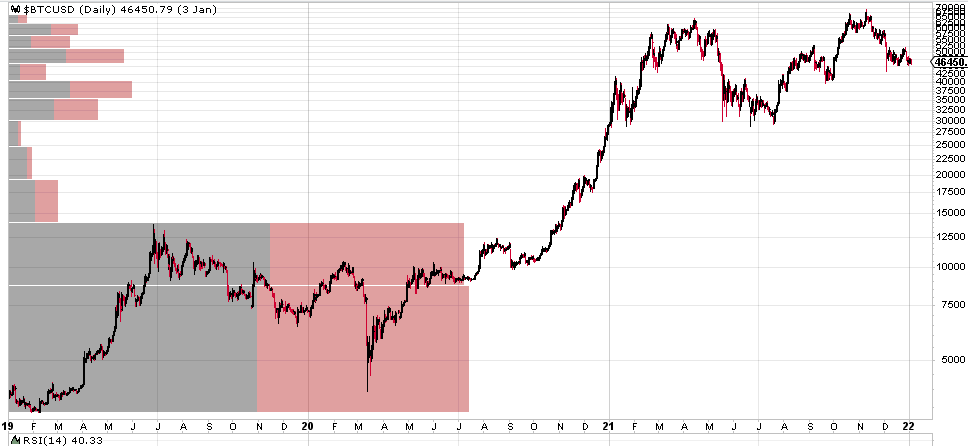
First a bit of recent history. In the midst of Covid despondency, Bitcoin reversed a preceding rally and plunged to a low of $3948 in March 2020.
Bitcoin Covid lows (stockcharts.com)
Bitcoin Covid lows (stockcharts.com)
But Covid caused the Federal Reserve to pull out all of the stops and engage in massive money-printing to jump start a failing economy. Bitcoin subsequently soared to unprecedented heights of $68,978 a 1600% gain in just 2 years, peaking in November 2021.
Since then, Bitcoin gave back $53,498 dollars (78% measured off the high), dropping as low as $15,480 in late Nov 2022. Talk about a roller coaster!
Speculation is high on both sides of the debate. Is the final bottom in? Is Bitcoin doomed? Will cryptos disappear in a digitally enhanced version of Dutch Tulip Mania?
Let’s use a little technical analysis to find out.
Technical analysis is either voodoo or the best thing since my mother’s peanut butter and jelly sandwich. Or maybe a mix of both. Over the last 15 years of trading, I’ve gone from complete sceptic, to curious dabbler, to ardent follower.
Bottom line, I believe an investor ignores technical charts at their own risk. For all of their hocus-pocus, line-drawing complexity, technical charts reflect the psychology of crowd behavior. Crowd behavior is the number one factor affecting prices in the short to medium term. Very long term reality of profits and losses, service and product quality do intrude and shape stock prices. But that can take a loooonnnnng time.
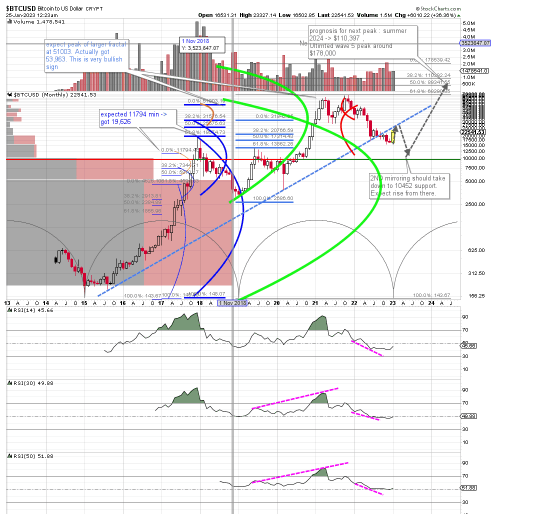
Take a look at this chart, which shows a long term chart of Bitcoin using weekly candles extending from 2015 to the present day.
Bitcoin technical analysis and prognosis Jan 2023 (stockcharts.com)
Bitcoin technical analysis and prognosis Jan 2023 (stockcharts.com)
Sorry about all the squiggly lines, and the confusion of colors. I’ll have you focus on the green ellipses first. These represent the waves of Elliot wave analysis. Using Fibonacci calculations of the smaller fractal waves within that larger green wave, I had expected Bitcoin to max out at $51,003. Instead, Bitcoin peaked at $53,963.
When this overshooting happens, I’ve noticed it’s usually quite bullish for the long term prognosis of the underlying equity. Let’s call that point 1 for the Bull case.
But first you’ve got to expect a retracement of at least 38.2%. Well we’ve already had more than that. In fact, we’ve seen a drop of more than 62% ( reached at $25,552) of the entire rise since the 2015 lows.
Wait, but that’s a point for the bearish case, more often than not a drop of more than 62% is a sign that the stock wants to retrace 100%. That would mean a drop all the way to $155!
If that happens to Bitcoin, IMHO, put a fork in it. It’s dead. But I don’t think that’s what the charts are saying.
Look at the 30 and 50 period RSI slopes drawn across the highs that correspond to price highs. Those are drawn with pink lines. The trace of the highs is convergently pointing upwards along with the price highs. Those tell me that this retracement of Bitcoin will be severe, but will not eclipse the original rise.
But also look at the slope of the lows in pink. They’re still pointed down. That usually means the reversal of trend from down to up is not over yet. More pain is to follow over the next weeks.
When Bitcoin is ready to really bottom, we’ll likely see the slopes of the lows being positively sloped.
Where do I expect that to happen? Well right around the $10,400 level, give or take. That represents one Fibonacci 168% projection down from the prior (red) wave traced down from October 2021 to January 2022. This mirroring effect occurs about 80% of the time. It’s a minimum, not a maximum value.
Nothing prevents the mirroring wave from moving lower, technically speaking. So why $10,400? Because that’s where there is a lot of support formed over multiple pivots points over several years backed by high levels of buying and selling volume.
Lost you already? Sorry for the complexity. Let me simplify. Check out the traced grey arrows. That’s what I see Bitcoin doing. Retesting the ceiling at around $34,000, dropping from there to $10,400, then onwards and upwards to reach new highs around $110,000 by summer of 2024.
As mentioned in other articles, the greatest area of uncertainty in my technical analysis is the time factor. I’ve used time cycles shown in the grey arcs at the bottom of the graph. Those put the peak at around mid-2024. But quite frankly, I’m nowhere near as confident of that time projection. So please don’t bet on it by fine tuning your option bets on that exact timing.
Short answer: of course not! Flippancy aside, it’s been known to happen… So I invite the reader to review a contrary view on these SA pages, which I find very well written: Bitcoin: Significant Recovery Expected (Technical Analysis).
So where do I differ from Mr. Grummes’ analysis? I share his long term view that the dollar is threatened by geopolitical events. I also believe the international monetary order is in the midst of a decade long collapse and reset, which will ultimately benefit Bitcoin.
I also agree with his statement that Bitcoin is likely to retrace by at least 38%
Even if Bitcoin would take it a bit easier in 2023, a recovery up towards the 38.2% retracement at around 35,000 USD would be easily conceivable.
But that’s the point at which our analysis diverges. I think that the volume of buyers at $34,000 just waiting to be made whole again is very large. (Just think of all of the spouses hiding their brokerage statements from their better halves.) Those create big selling pressure.
A retracement mirroring the 2019 by 62% is certainly possible. But not likely in my view. First, 62% of retracements are statistically much less frequent. Second, a trace of the RSI price levels to their matching prices suggest the $35,000 level. That could evolve later to point higher, but right now it does not. Third, big market reversals are usually formed slowly over many months so that Mr. Market can exert maximum pain out of impatient or inexperienced investors. That has not yet occurred.
Real world events are taking shape quickly, and likely to send more pain into crypto markets. The last 2 weeks have seen a lot of action around the impending or possible bankruptcies of Gemini, Genesis and possibly even the Digital Capital Group.
Those factors guiding those developments are highly complex and extremely interwoven, but there is little doubt that they could have major implications for the crypto space.
Secondly, the US Congress, the Securities Exchange Commission and the Commodities Future Trading Commission are all vying to exert their influence over crypto markets and flex their political muscles. Until that finally crystallizes into a more clear cut regulatory approach, you can expect this to weigh heavily on market uncertainties.
If you are a hard core Bitcoinist you might want to go all in at these prices. What’s a worst-case 50% drop in light of a possible and likely 500% gain in a few years’ time?
But for most investors, I would suggest a different approach. If you like Bitcoin (and I do) invest a small amount (perhaps 10% of your ultimate stake) so you don’t suffer too bad from FOMO if I’m wrong. Consider taking profits around $35,000.
If prices do drop to the $10k level, go in with 50% of your stake. Make sure whatever you invest in, you’re comfortable holding through major volatility. Would you sell if Bitcoin drops to $3000? Then don’t invest. It’s not impossible.
For most investors, I think a dollar cost averaging approach, spread over about a 2 year period makes the most sense.
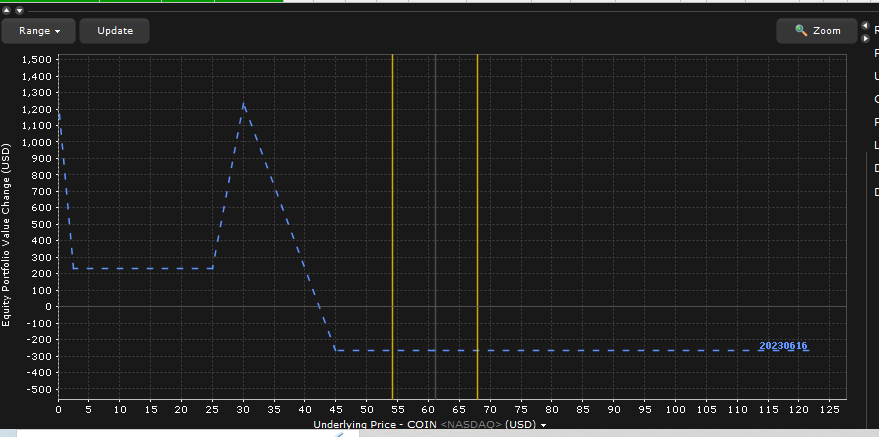
Me? I’ll use options. I use broken wing butterfly trades to bet to the downside and give myself about 4 months for that to occur.
bearish option trade on COIN (Interactive brokers options)
bearish option trade on COIN (Interactive brokers options)
As you see from the graph above, a $267 position could yield a maximum return of around $900 to $1200. These reflect my current positions. If I’m wrong and COIN either does not move down or takes longer to do so (later than June 16, 2023, I’ll lose the entire premium paid, or $267. This graph reflects the price of the positions taken at the date of expiry in June. If COIN were to drop precipitously to the $30 price level, my gains not immediately be so large. This trade benefits from the passage of time and is largely not affected by options volatility.
Strategies like calendar trades or broken wing butterfly trades offer very attractive risk reward relationships, in which you lose only a fraction of what you gain if you’re wrong but make many times your investment if you are right.
The biggest risk in the strategies lies in execution. You must enter into the trades using limited orders and in the right sequence to avoid unintended margin risks. Please consult with a professional if you do not have experience with this.
This article was written by
Disclosure: I/we have a beneficial short position in the shares of COIN either through stock ownership, options, or other derivatives. I wrote this article myself, and it expresses my own opinions. I am not receiving compensation for it (other than from Seeking Alpha). I have no business relationship with any company whose stock is mentioned in this article.
Additional disclosure: I currently am out of my bullish Bitcoin positions. As mentioned I see a run up to $35k a very likely, but then a drop from there.
 How To Make Huge Profits In A Short Time With Crypto
Get detailed training system that shows an absolute beginner (without any skill) how to make huge profits in a short time with crypto.
 Crypto + NFT Quick Start Course
The #1 course for profit in the Crypto & NFT world - You will discover the secrets that 99% of people don’t know yet